One of the questions that I get asked all the time is how to integrate cloud solutions into monitoring platforms. Whether it is Azure AD sign-in logs, Exchange Audit Logs, or anything else, the primary desire is a centralized location for these logs to provide a “single pane of glass”.
In the past, Rich and myself have talked with clients about using Azure Log Analytics as the centralized platform. However, it was never really a SIEM, and many clients wanted to keep using their on-premises solutions, such as Splunk, ArcSight, or similar.
With the addition of Azure Sentinel on top of Azure Log Analytics, we’re starting to have more conversations about leveraging cloud-native solutions instead of bolted-on products. Because of the work we do in the Microsoft security space, one of the items we wanted to do was push data from Microsoft Defender ATP (formerly Windows Defender ATP) into Log Analytics, which we can then write queries and alerts on within Sentinel.
To do this, we decided to use Azure Logic Apps for two main reasons:
- It is low-cost, with a consumption-based model
- It provides a modular, graphical means of authoring workflow
This Logic App consists of five easy steps.
Step 1: The Trigger
#TriggerWarning
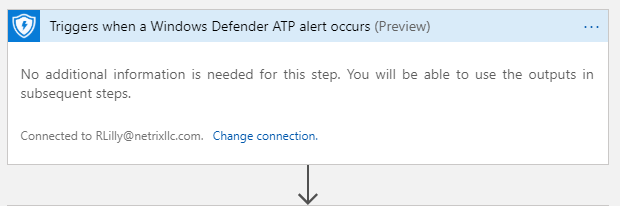
All Logic Apps must start with a trigger, either based on an event or a schedule. We decided to start this Logic App off simply: a trigger based on when a Defender ATP Alert occurred. Pretty simple, and we just used Rich’s account for the API integration.
Step 2: API Call, The First
The first real step after receiving data via the trigger is to… Receive data.
Huh?
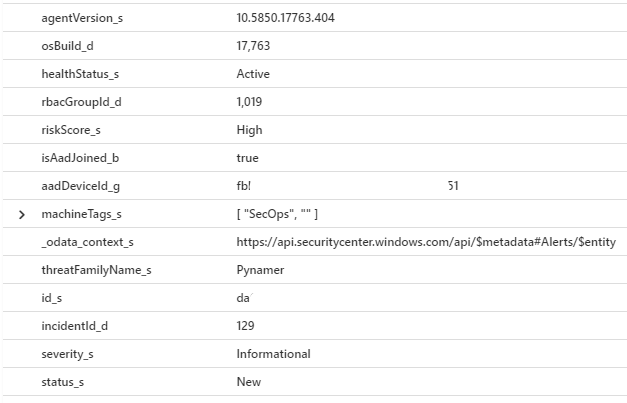
To push data into Log Analytics and have it parsed properly, we want to submit each alert (and corresponding information) as a single JSON object to the Log Analytics endpoint. However, the output from the trigger is just the alert ID and machine ID. We could send that into the activity specifically used for the retrieval of alerts that is built in to Logic Apps, but that gives us a nicely parsed object, which isn’t what we want.
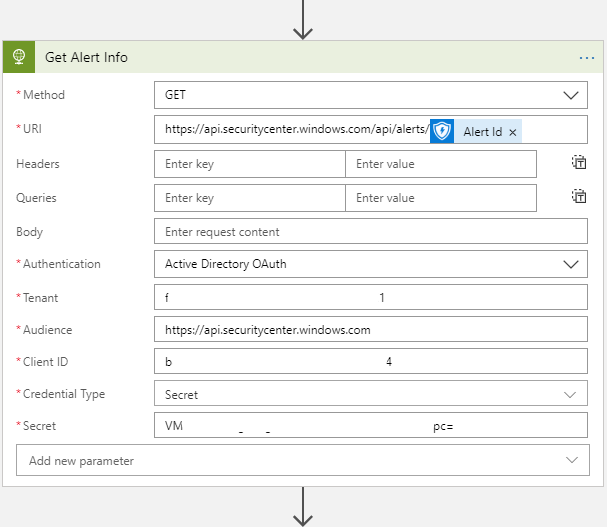
To fix this, the first step we are doing is to pull the alert directly from the MDATP API, which does give us our JSON object. To do this, we have created an App Registration in Azure AD to handle this connection for us. We are using the following configuration:
- Method: GET
- URI: https://api.securitycenter.windows.com/api/alerts/<Alert ID from Step 1>
- Authentication: Active Directory OAuth
- Tenant: <AAD Tenant GUID>
- Audience: https://api.securitycenter.windows.com
- Note the lack of a trailing “/” at the end
- Client ID: <App Registration Client ID>
- Credential Type: Secret
- Secret: <App Registration Key>
Step 3: API Call, The Second
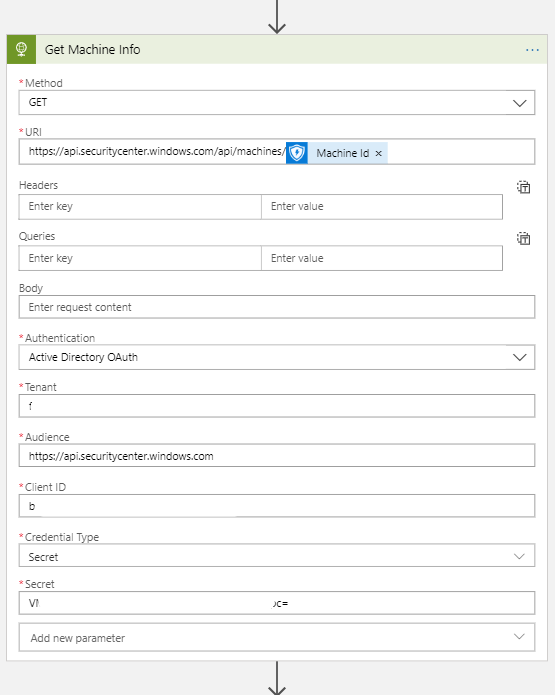
Because alert info isn’t everything we need, we also decided to pull in machine information for a given alert. Luckily, this configuration is nearly identical to the other API call, just a different endpoint. For this, we’re using the following settings. Stop me if this looks familiar:
- Method: GET
- URI: https://api.securitycenter.windows.com/api/machines/<Machine ID from Step 1>
- Authentication: Active Directory OAuth
- Tenant: <AAD Tenant GUID>
- Audience: https://api.securitycenter.windows.com
- Note the lack of a trailing “/” at the end
- Client ID: <App Registration Client ID>
- Credential Type: Secret
- Secret: <App Registration Key>
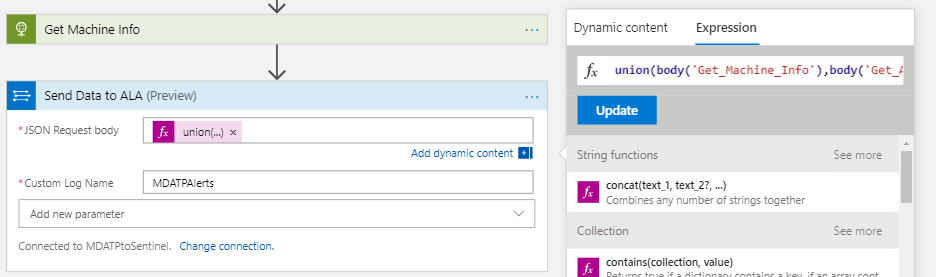
Step 4: Putting it All Together
Now that we have all of our data, we can push it into ALA. However, we want to ensure that the two items are linked, and we don’t want to maintain multiple tables. So to fix this, we’re simply joining both JSON objects into a single one using the union() function in Logic Apps. Luckily, we aren’t sharing many fields between the two objects, so we don’t have to worry about overwriting properties. This is then utilized by the in-box action to send data to Log Analytics, into a custom log we’ve named MDATPAlerts. Note: Log names in Log Analytics are case sensitive, so if you are creating multiple Logic Apps to forward data, our MDATPAlerts log would be different from a MDATPalerts log.
The Final Product
In the end, we now have all MDATP alerts going into our workspace, which we can generate alerts on in Sentinel, create dashboards, and correlate against other potential IoCs. All these logs are going into our MDATPAlerts_CL log (CL meaning Custom Log) in Log Analytics, and can be searched from there. Then the fun begins!